
Editor's note: author Jack Zhang is the CEO of an analytics company, Greenlight Essentials, and the following post represents his opinions on Relativity Media and the overall role analytics platforms play in the film industry. This is in no way sponsored content and no money changed hands; for more, see our comment below.
In 2004, Ryan Kavanaugh and Lynwood Spinks founded Relativity Media. Kavanaugh drew in billion-dollar investments from the hedge fund Elliott Management and claimed that Relativity could reduce the risk in the uncertain business of filmmaking by using a Monte Carlo model. They said it was the future of Hollywood. In reality, it was an epic failure.
After producing and releasing films for nearly a decade, on July 30th, 2015, Relativity filed for Chapter 11 bankruptcy following protracted lawsuits and missing loan payments.
Why did Relativity Media’s Monte Carlo model not work? Is there no way to use algorithms to make better decisions in the film industry? We discuss these questions and more below.
Relativity Media found a non-risky way to steadily lose investors' money.
How does the Monte Carlo method work?
Simply put, the Monte Carlo helps us think about and observe risk by incorporating probability instead of point estimate.
Let me explain these two concepts in an example: imagine there are two people, Owner A and Owner B, who share the ownership of a restaurant. They need to have an understanding of how much profit their restaurant is going to make in the next month so that they can decide whether or not they will close the business.
Owner A will use a point estimate (a single value as the best estimate) and Owner B will use Monte Carlo methods. For simplicity's sake, let’s assume that the profit of the restaurant is equal to its revenue minus its expense (Profit = Revenue - Expense) and that they are not related at all.
The way Owner A will estimate the profit for the next month is as follows. First, he looks at the revenue from past 6 months:
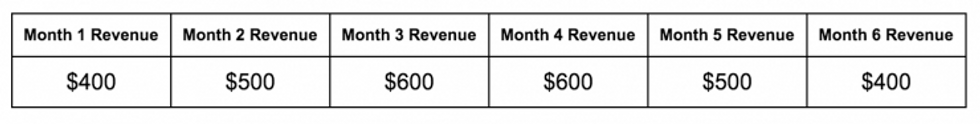
He takes an average of them ($500), then uses that average as the estimate of next month’s revenue. He does exactly the same thing for the expenses of last 6 months:
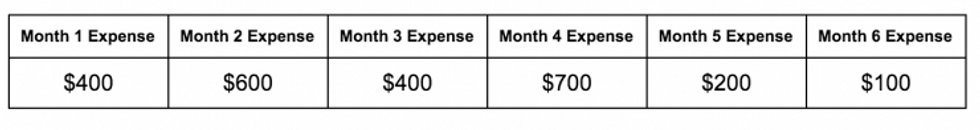
His estimate of expense for next month is $400. Finally, he subtracts the expense estimate from the revenue estimate to get his profit estimate. Owner A, through a point estimate, concludes that there will be a profit of $100 and decides that they should stay open.
Now, let’s look at Owner B. He sees owner A’s estimate and says, "Your estimate is not bad, but it doesn’t tell us about the risks that we are taking. Let me do a Monte Carlo simulation."
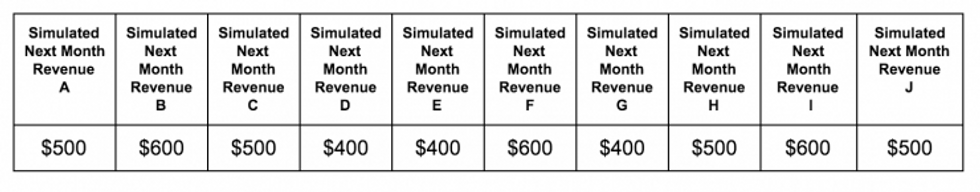
He goes on to look at the past 6 months of revenue and pulls a dice out of his pocket. Each face of the dice represents each past month’s revenue. If he rolls it 10 times, he has 10 possible outcomes for the next month. Note: the following simulation is random. He rolls 10 times and gets the following 10 simulated revenue numbers:
He does the same thing with expenses and ends up with 10 more values:
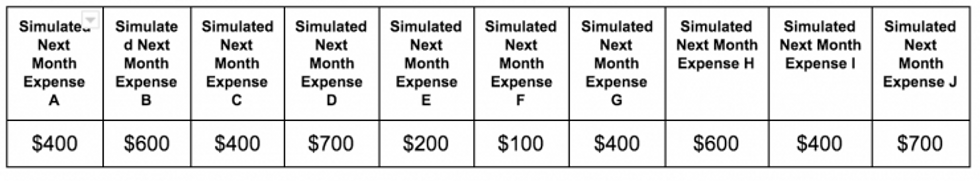
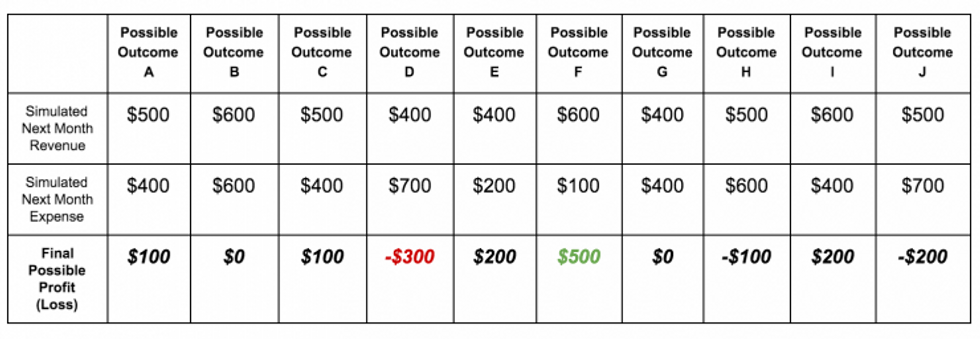
Owner B says to his partner, “We could lose $300 at the most or make $500 at the most. We have about a 30% chance of losing money and 70% chance of making money based on Monte Carlo simulation. I think the risk level is reasonable, so we should stay open.”
The problem with Monte Carlo
From the above example, we can see how using Monte Carlo simulation, rather than just a point estimate, gives much more insight into risk. In the real world, though, we simulate a million times using computers before drawing the final conclusion. Monte Carlo itself is a very useful tool to estimate and illustrate risk; for that reason, it is a popular method to use in the financial world.
Monte Carlo does not build models. People build models.
However, Monte Carlo does not build models. People build models. Statistical model-building is both a science and an art. The person who builds the model needs to design the underlying input variables the model is going to use—the relationships between these variables and the statistical distribution he/she is going to use for the model. Most of the time, making these choices means taking an educated guess: by observing real-world data, you try your best to match it.
While Monte Carlo is useful for recognizing risks and variation involved in the already built model, it certainly cannot tell you which variables to put into the model and how to formulate the relationships—such as between actors, directors, and plot—in any given film. In the restaurant example, we already know that the underlying model is Profit = Revenue - Expense, with the randomness of the revenue and expense matching the randomness of the dice. However, for complex problems like movies, there are many more unknown variables. How do we formulize the revenue of a given film (Film’s Revenue = Actor, Plot, Production Budget, etc.)? Is it even possible?
All of these are factors that can determine the performance of the final model, and many of these factors are assumptions. Without knowing all of the above information of Ryan Kavanaugh’s model (I don’t think he told anyone; these type of models are usually highly proprietary), it is very hard to say what he did wrong. Likely, he misused Monte Carlo without fully understanding the fundamental framework of statistical modeling.
However, we do have data on the performance of most of his films, and we will analyze Relativity Media’s films’ revenue using Greenlight Essentials’ patent-pending software to draw useful insights from the results.
How to measure a movie's success using data
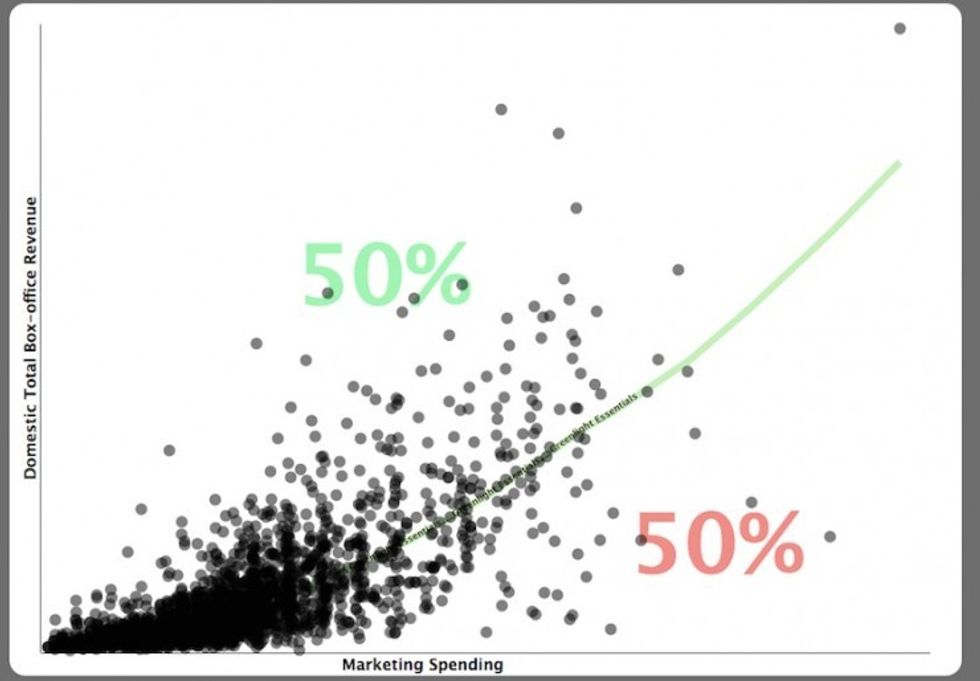
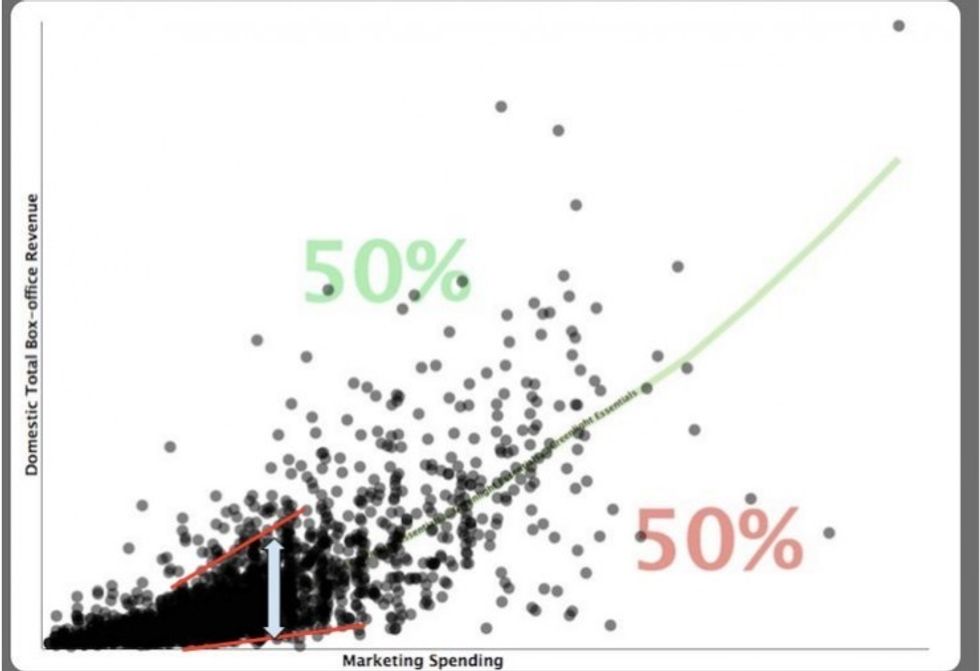
Each data point in the diagram represents a single movie, where its box office revenue is measured on the vertical axis and its marketing spend is measured on the horizontal axis. The green line in the middle of the graph is the benchmark that illustrates the relationship between marketing spend and revenue.
In the graph, 50% of all films are above the benchmark and the 50% are below. The movies above the benchmark are classified as out-performers, earning more revenue than the market benchmark. The movies below the benchmark are classified as under-performers.
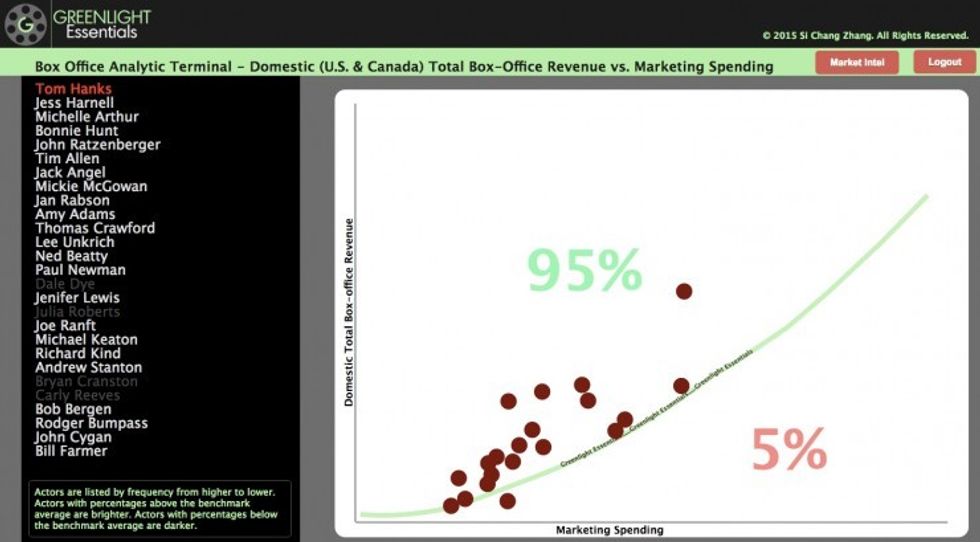
When we see an imbalance in that percentage, we can draw useful insights on the underlying factor. In this case, films with actor Tom Hanks have a 95% chance of outperforming the benchmark. Thus, we can assume that Tom Hanks is very bankable in general.
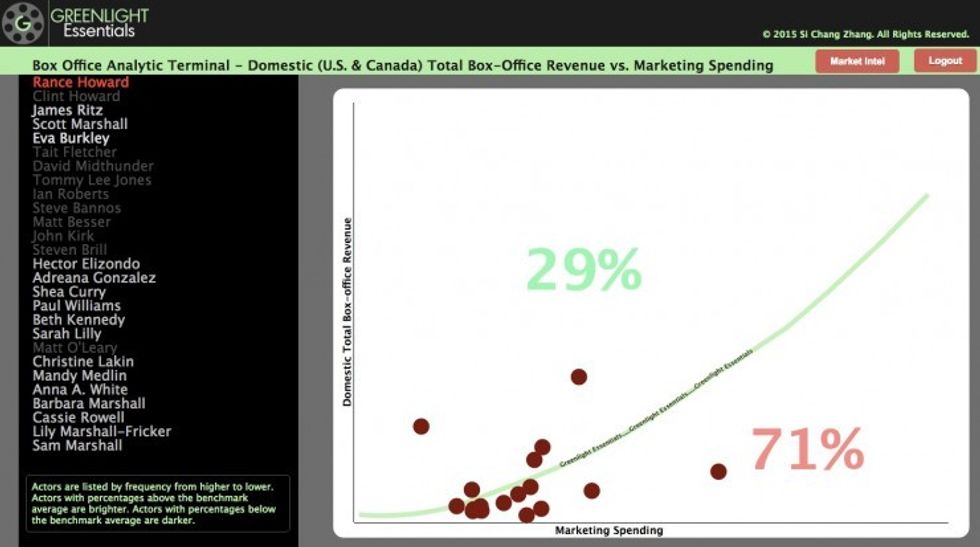
On the other hand, Rance Howard has only 29% of his films above the benchmark, so he could be considered not bankable in general.
Looking at the spread of all the data below, we can see that film is a very risky business with high variation and that the riskexponentially goes up as marketing spend increases.
Relativity Media films' box office performance
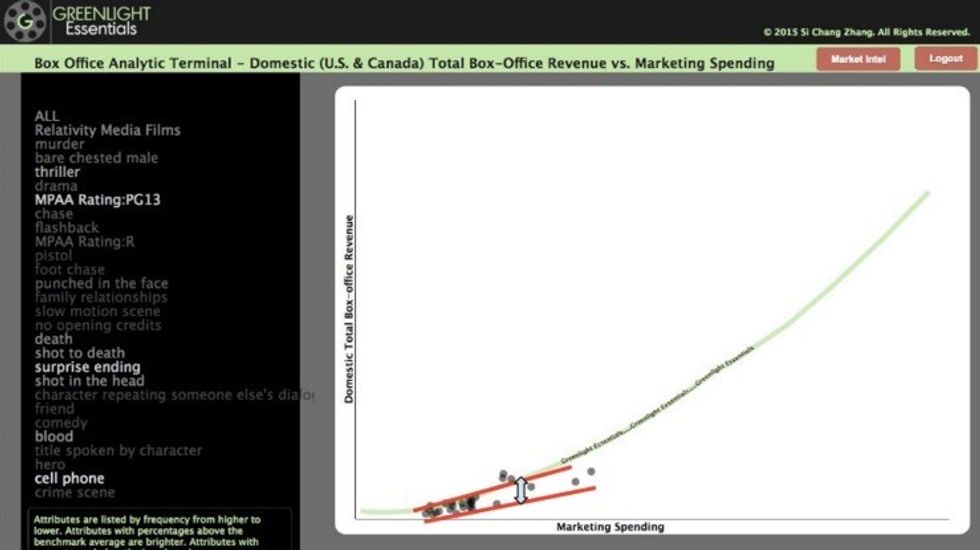
Looking at the above graph and comparing it to the previous ones, we can see that all of Relativity’s releases are clustering together with a much smaller variation. This means that their risks are reduced.
So, did we just show that Ryan Kavanaugh’s algorithm worked? Not so fast. These films have much less variation, even though most of them are below the benchmark. In fact, only 22% of all Relativity films are above the benchmark.
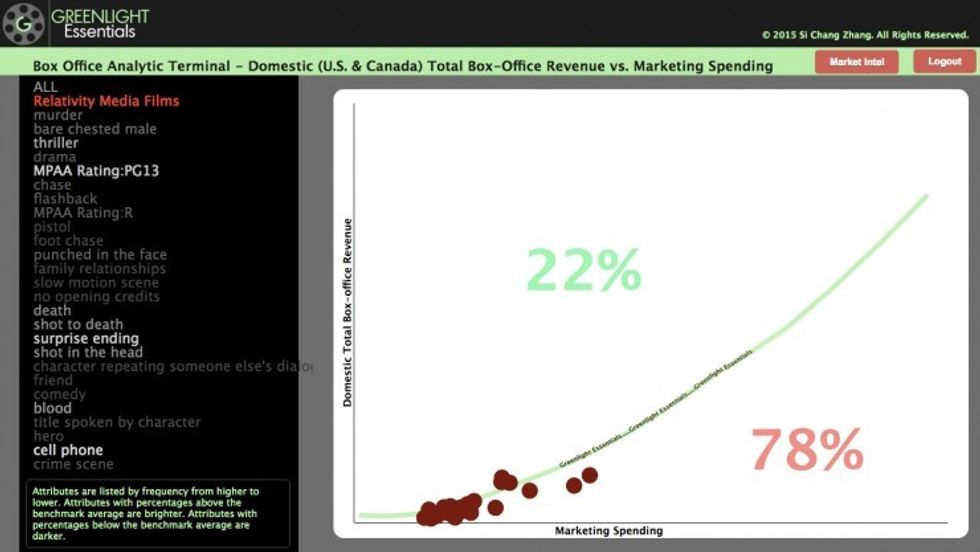
This means that their films have a much lower average return than the market. Relativity’s model worked in terms of shrinking the risk, but it has a negative return compared to the market. Given that 22% is a large margin away from the market average (50%), Relativity’s model is highly likely to have a negative absolute return. In other words, Relativity found a non-risky way to steadily lose investors' money.
Perhaps they were too concerned with the idea of shrinking down the variation/risk—so much so that they were not thinking about the return. Maybe their objective of shrinking down risk is not right, or maybe high risk (variation) is in the nature of the film business, and forcefully going against it would only damage the return.
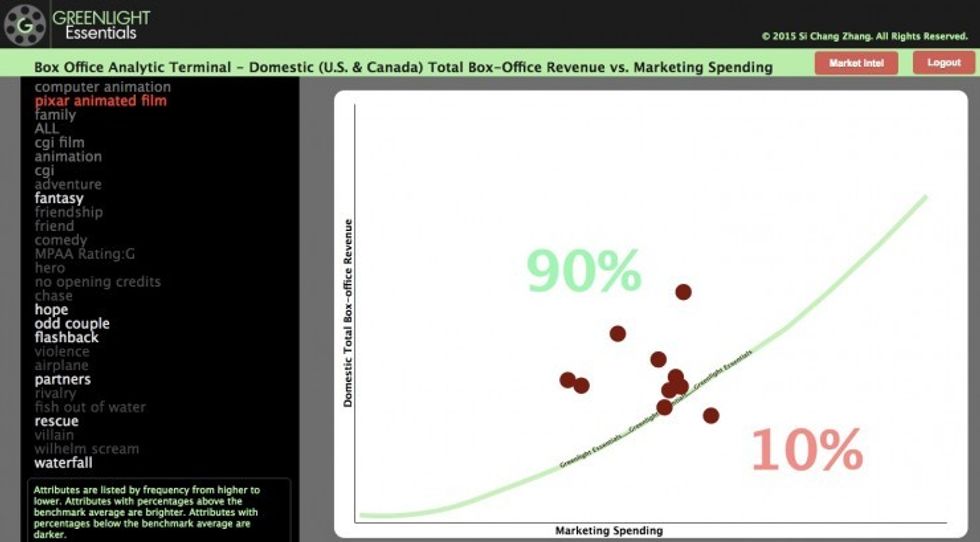
Pixar films' box office performance
Now, let’s look at the contrasting example: Pixar. As we can see in the graph below, 90% of Pixar-animated films are above the benchmark. However, Pixar films have much higher risk compared to Relativity’s films. They are very successful because their average return is high enough to take care of this excessive risk/variance, which resulted in 90% of their films above the benchmark.
You are probably already wondering what the deal is with the software introduced above. In fact, this is how we answer the question:
Is there no way to use algorithms to make better decisions in the film industry?
We can still use math and technology to help us make much more informed decisions in filmmaking. All models are wrong, but some are useful, and that is the logic behind Greenlight Essentials’ software: to be useful. We do not make any assumptions to build models or simulate risks; rather, we only use real-world real data points to draw real conclusions.
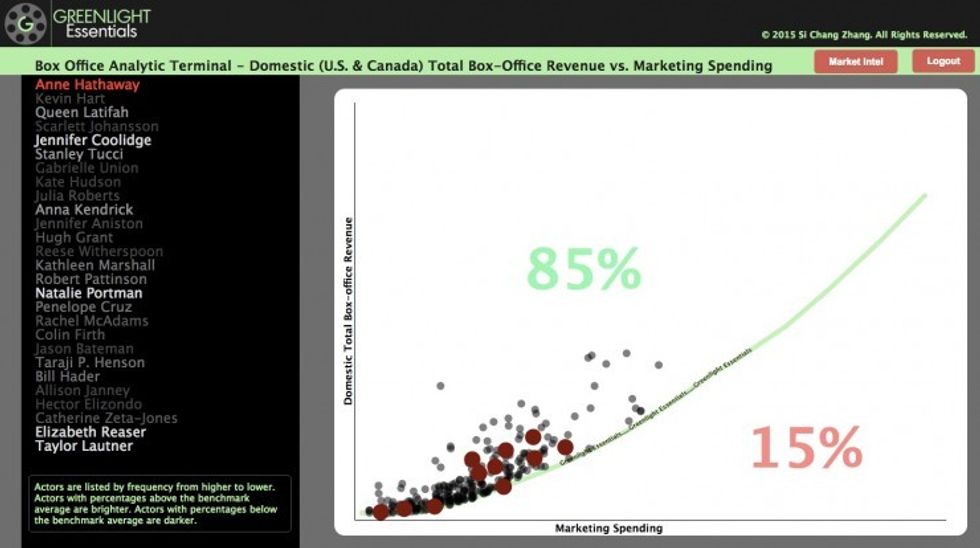
For example, we can use the software to produce highly bankable cast suggestions based on genre and plot. For instance, if we look at the Romance genre and only focus on films that have outperformed the benchmark, we can see that Anne Hathaway and other names on the list are very bankable actors in the romance genre (almost the same score as Pixar!). We can also look at the graph and see the amount of risk (variation):
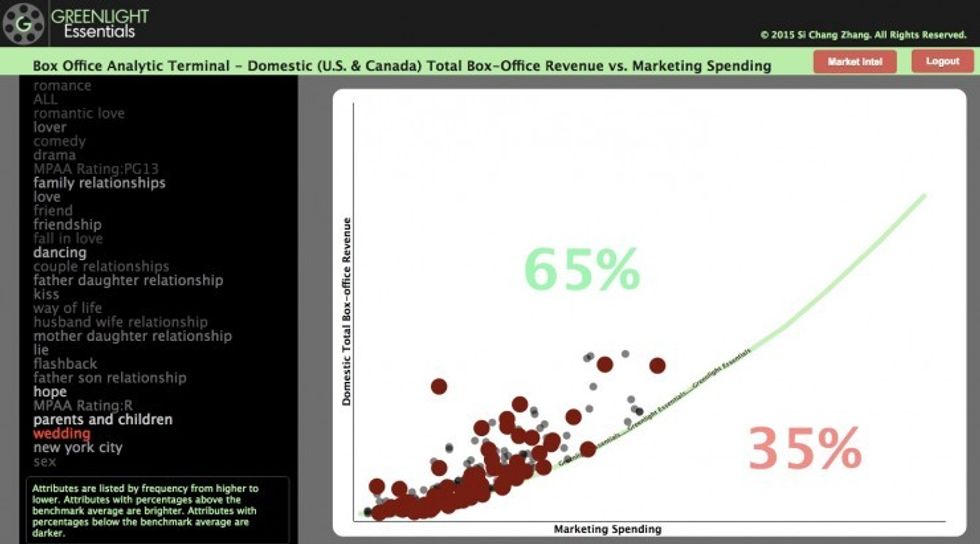
Plot elements like wedding, parents, and children are also very bankable in the romance genre. We can even use the software to find out where the target market for this specific subject matter is (i.e., people who love wedding in the romance genre) and their demographics:
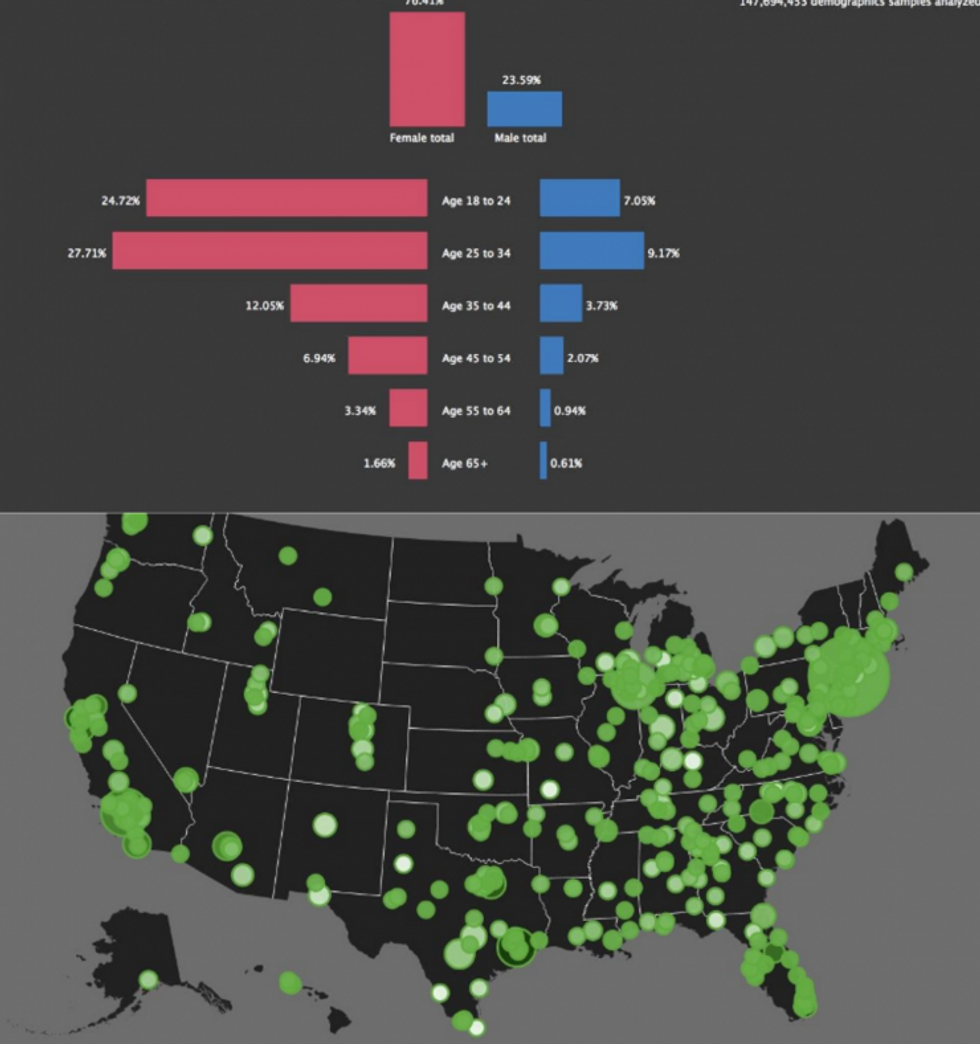
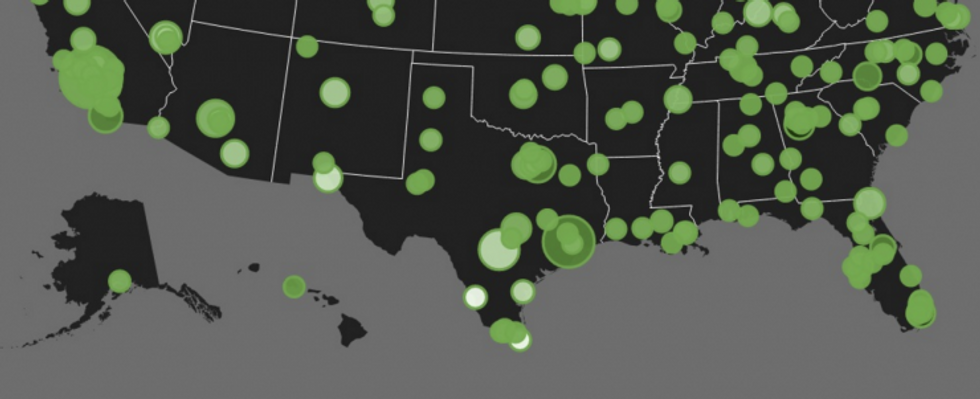
On the map above, each circle represents a city. The size of the circle represents the market share of the city and the color of the circle represents how enthusiastic people are about the subject matter (in this case romance). The lighter the color, the more enthusiastic people are. We can also see that most of the people who are likely to watch this genre are females under the age of 35. This can help us picture the target market so that we can use our creative mind to match their taste.
Here's an example of how the location map’s information would be useful. Looking at the horror genre’s location map, we can see that most of the light-colored cities are in Texas:
By looking at the actual numbers on the detailed data chart, we can see that El Paso has the largest market share among the top four most enthusiastic cities about Horror genre:
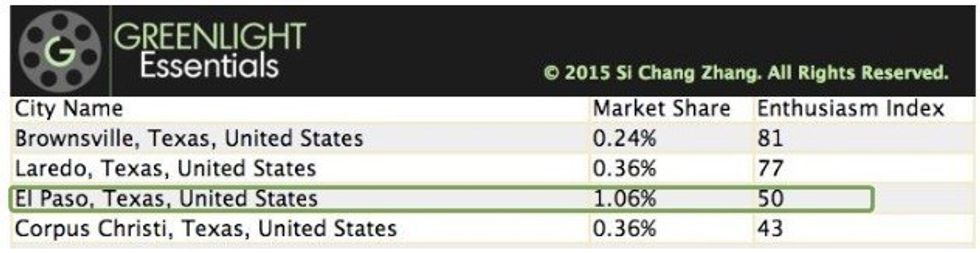
Several days ago, I came across an article from The Wall Street Journal discussing the horror film Insidious.
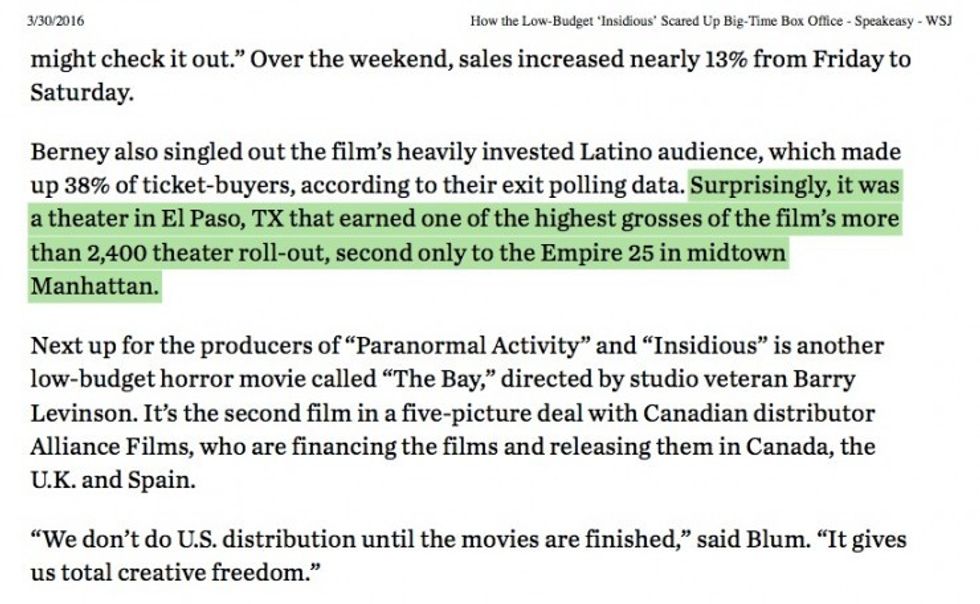
Not so surprising! It's clear that by using the location map above, we can see where the demand is for the film.
With this tool, you'll get to know the people who have historically been interested in the subject matter of your film and come up with creative marketing strategies that feed the right content to the right people.
How can all of this help filmmakers succeed?
If you are an indie/low-budget filmmaker who is self-distributing your film or operating under a tight marketing budget, this information can be extremely useful. You can allocate marketing resources much more effectively according to a target market demand (more bang for the buck). With this tool, you'll get to know the people who have historically been interested in the subject matter of your film and come up with creative marketing strategies that feed the right content to the right people.
Math and science can never completely solve the mystery of predicting film outcomes. Without fully understanding model-building implications and blindly combining science and art, you can easily cause financial disasters such as Relativity has done. However, strategically using math and data in a useful way can help us find evidence-based information (such as plot attributes’ bankability, actors’ bankability, and target market descriptions).
All these goodies are not easily extractable without today’s technology. Used correctly, this information, as Greenlight Essentials’ software offers, can help filmmakers better match their audience’s taste and help investors make superior average return with known risk.
Jack Zhang graduated from the mathematics faculty of University of Waterloo with a bachelor of mathematics, honours degree. He is the CEO and chief software architect of Greenlight Essentials, where he developed and implemented his patent-pending data analytic process for entertainment product formulation. Prior to Greenlight Essentials, he has had experience in the technology and finance industries.