Color grading is a delicate balance of gain, color, dynamic range, and white balance. There’s also hue, saturation, and luminance. Software companies have built an entire industry sector around creating killer apps to easily color balance camera files to a desired color palette. It’s a delicate process that’s part science and part... well, voodoo, for lack of a better term.
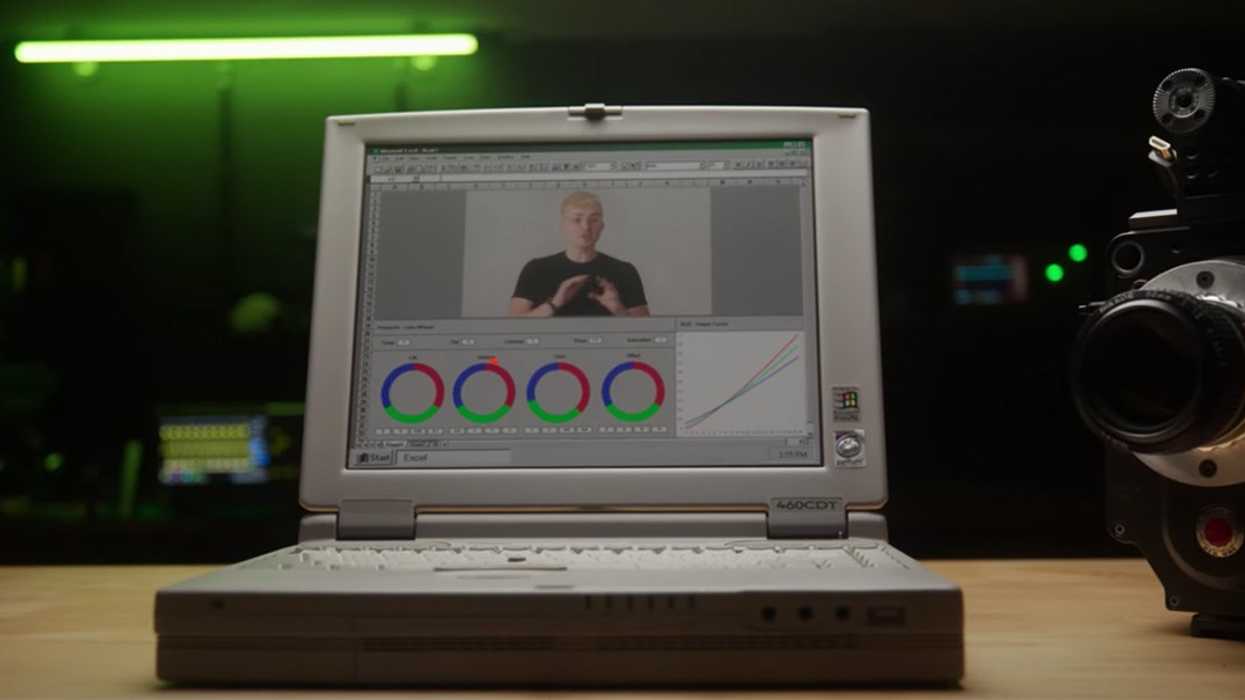
But would you believe that you can do the same thing with a spreadsheet? That’s what the nerds at Syrp Lab discovered in a recent episode of their YouTube series Film Science. To understand just what goes on under the hood of DaVinci Resolve and other color-grading utilities, they created a Rube Goldberg-like workflow using Excel and, along the way, achieved a greater understanding of just how color grading works.
Lift, Gamma, and Gain
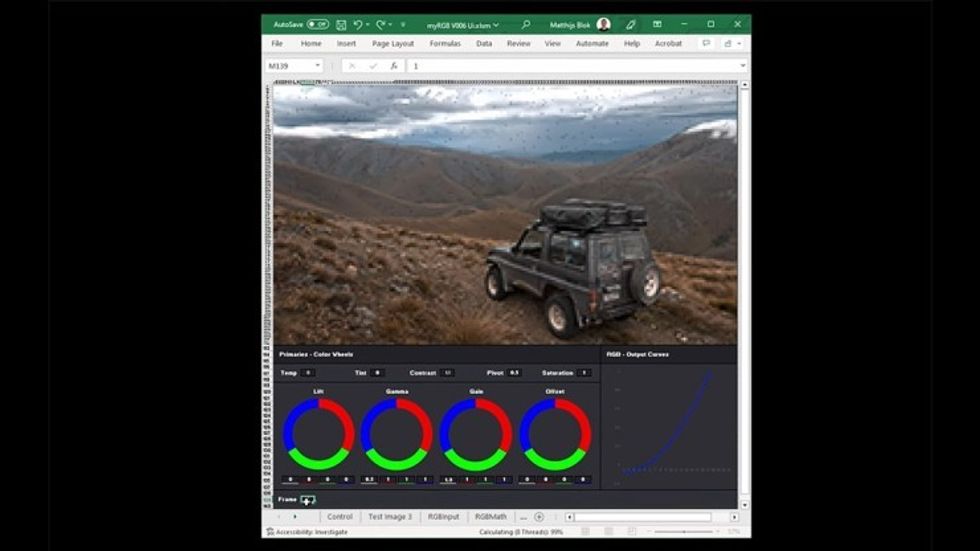
The basic premise of the thought exercise (made into an Excel workbook) is that color grading apps use basic math formulas to adjust the left gamma and gain of an image. It’s the one thing that DaVinci Resolve shares with your garden variety spreadsheet out of Excel. You might be more familiar with LUTs, or look-up tables, which function similarly, as they use math to transform your image from one series of RGB values to another.
 Credit: Syrp Lab
But back to the Syrp Lab. By using a laborious process of assigning appropriate values to every pixel in an image, it’s conceivable, however ungainly, to list those pixel values and then apply a formula to change those values to adjust them. Which the gang at Syrp Lab did. Once the formula was in, changing the parameters of the formula, and therefore the results became relatively simple, even if cumbersome.
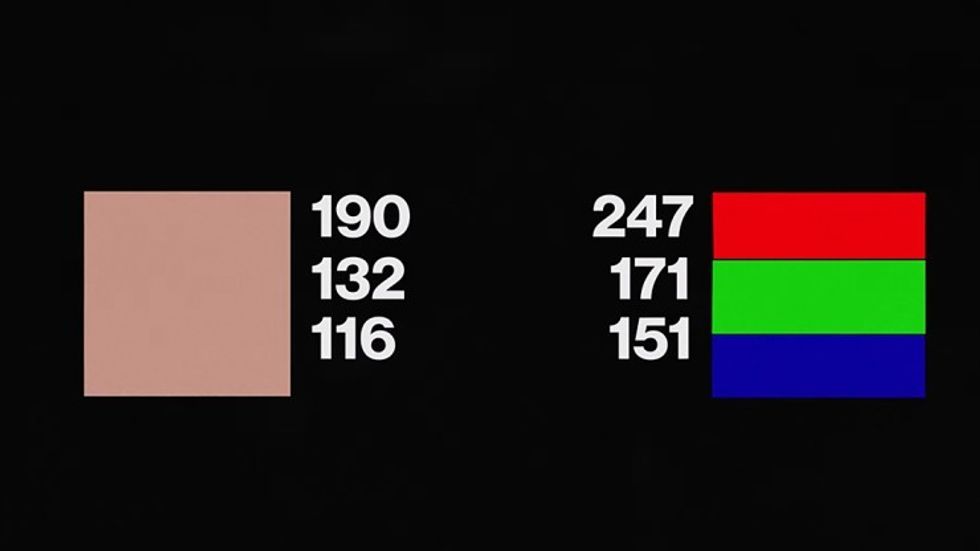 The color on the right is the same color as on the left, but brighterCredit: Syrp Lab
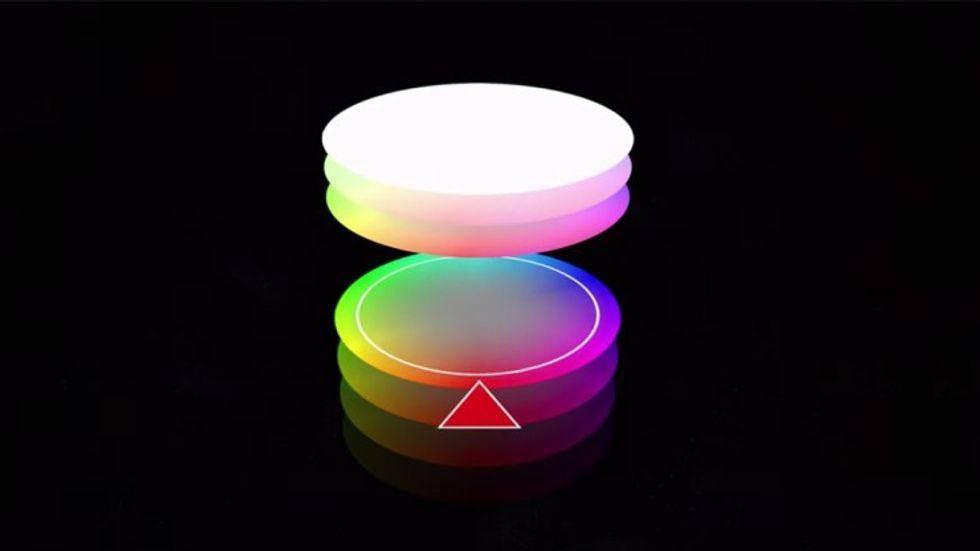
The experiment worked with lift, gamma, and gain, as well as color brightness and contrast. However, it fell short with more advanced color values like hue, saturation, and luminance of the RGB color space. For that, the crew had to turn to the more advanced tools of DaVinci Resolve.
The comprehend HSL, one would only need to imagine the trifecta of color as a cylinder. It becomes easier to envision the transformation process on a 360-degree pathway up or down, in or out, and around, all driven by math. Through that, the Syrp Lab lads were given an understanding of what was really going on.
The idea is to understand the science behind color grading rather than moving a bunch of sliders up or down until things look the way you want. In doing so, it’s possible to apply changes across a greater range of files or especially when dealing with a variety of cameras that need to be color matched.
 Credit: Syrp Lab
It's All Numbers
By understanding the math at a pixel level, a colorist can apply more advanced color grading techniques with masking and keying. DaVinci Resolve recently updated Version 18 to make it possible to adjust a moving mask as the subject moves, and in doing so, has opened up a variety of options for visual effects. So, why not with color grading on an exact level as well?
But if you want to get your geek on, Syrp Lab has a write-up, in addition to the video above, which takes a deep dive under the hood into how color grading is all about math. Granted, most of us won’t be doing it with Excel, nor should we. But in the end, that’s OK because you now understand what's under the hood.
What did you learn from this bonkers Excel workflow? Let us know in the comments!
Source: Syrp Lab