'Cinemetrics' Creates Intriguing Motion Graphs of Entire Feature Films

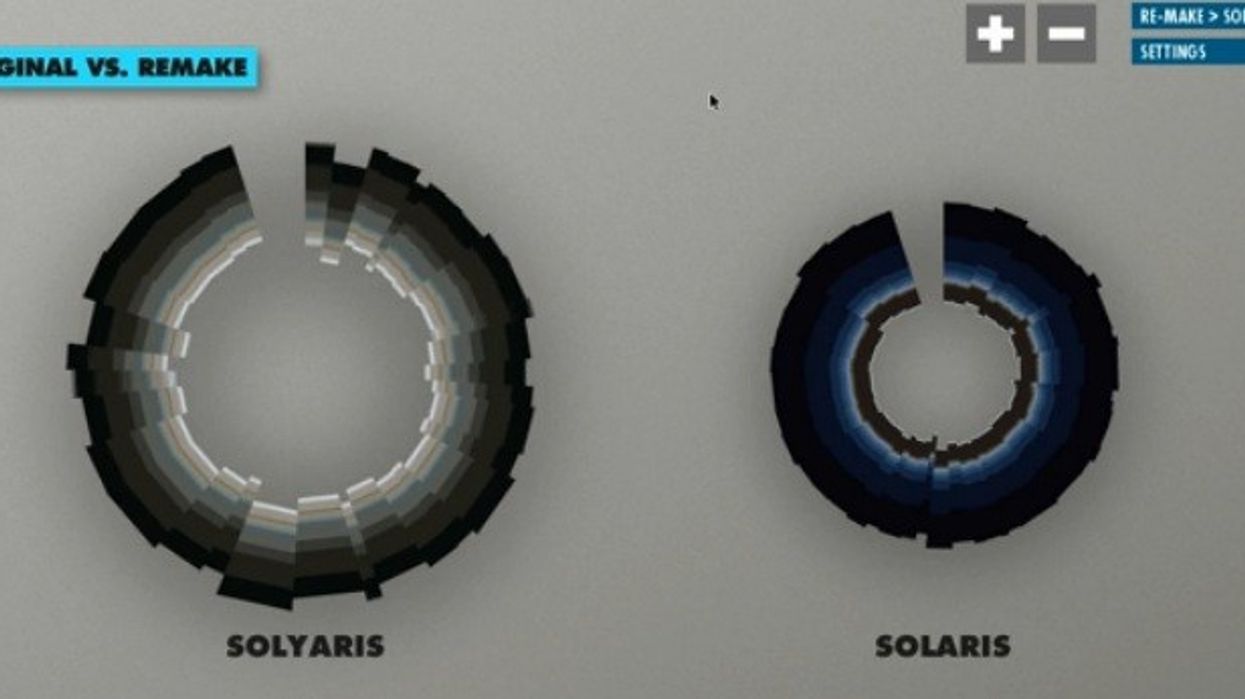
I love analytics, so it should no surprise that I find this project intriguing. Cinemetrics, a graduate project at the Royal Academy of Arts (KABK) by Frederic Brodbeck, captures an entire feature film and displays it as a moving, circular graph. Frederic describes the project as "an experiment to find out if the data that is inherent in the movie can be used to make something visible that otherwise would remain unnoticed," and I find that to be the case. One observation: [easyazon-link asin="B00009ATIX"]Steven Soderbergh's remake[/easyazon-link] of [easyazon-link asin="B004NWPY34"]Tarkovsky's Solaris[/easyazon-link] is the rare remake that has less motion than the original. Here's a video of Cinemetrics in action:
cinemetrics is about measuring and visualizing movie data, in order to reveal the characteristics of films and to create a visual "fingerprint" for them. Information such as the editing structure, color, speech or motion are extracted, analyzed and transformed into graphic representations so that movies can be seen as a whole and easily interpreted or compared side by side.
Frederick has also created some very cool posters which he's sort of selling (email him for more info) on his site:
The majority of the code is also freely available.
Link: Cinemetrics
[via FilmmakerIQ]


